EDC 521 Voltage Source Stability and Accuracy

IMG_8647

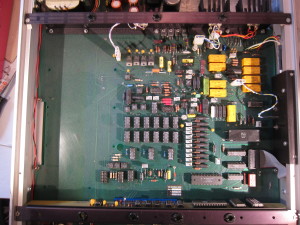
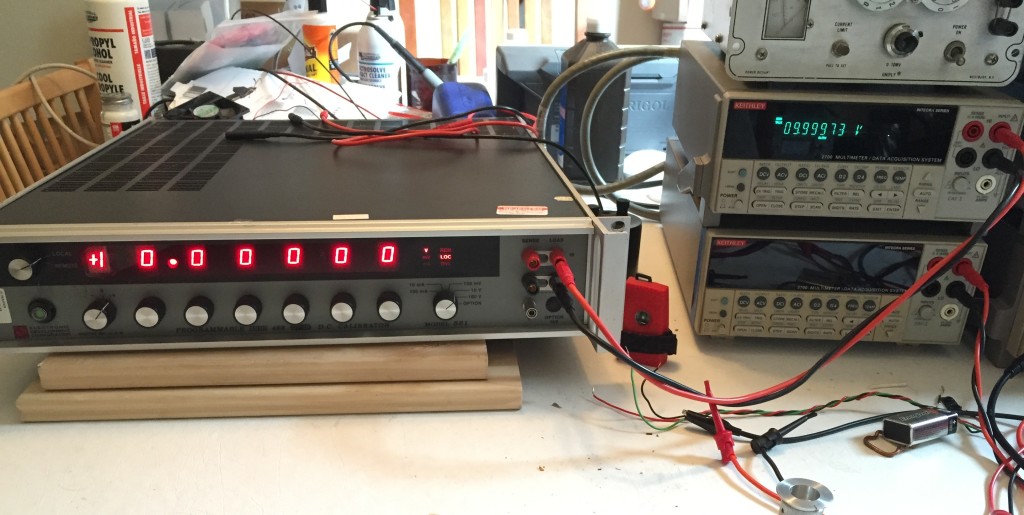
Last week, I cleaned up the used EDC 521 DC Voltage & Current Source I bought on eBay and ran it through some quick tests. The next day, I connected it up to one of my Keithley 2700 6.5 digit multimeters, started logging readings, and powered it up. Since then, I’ve been collecting voltage readings every 5 seconds so I could get a better sense of the device’s stability and accuracy.

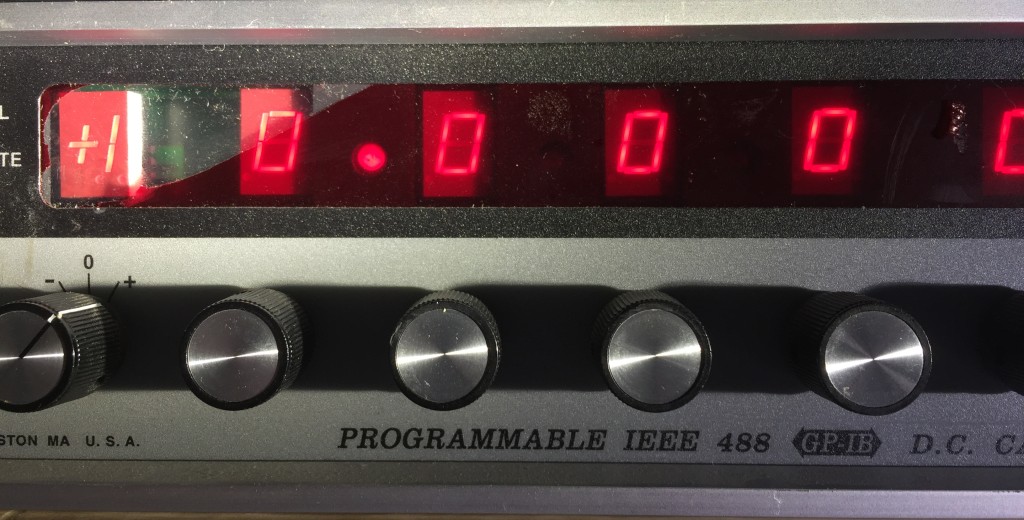
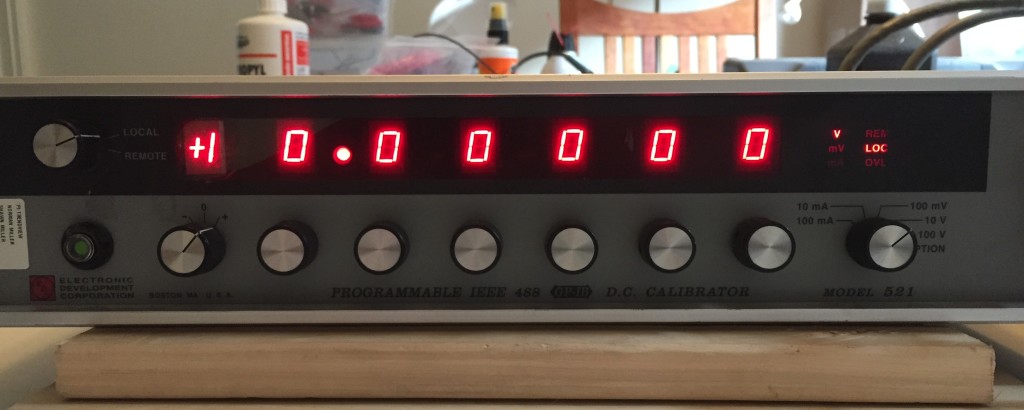
The EDC 521 was set to 10.00000v and powered on.

to4hr

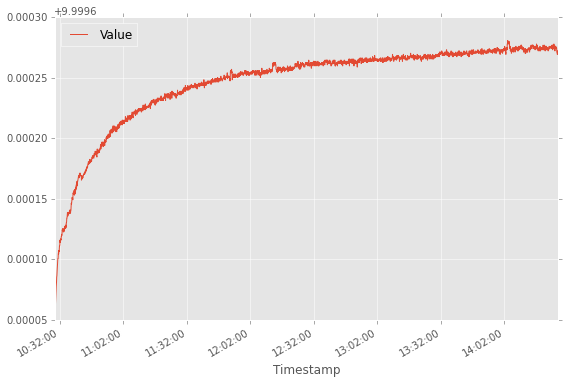
Once the self-tests ran the output turned on. The initial voltage was only 9.99954v, but climbed quickly. After 15 minutes, it was up to 9.99981v and still rising gradually. At the end of the specified two hour warm-up period, it was 9.99986v, well within the specified tolerance of 0.000258v (0.002% of setting + 0.0005% of range + 3uV), as well as the DMMs uncertainty of 0.000350v 30ppm of reading + 5ppm of range.

2to8hr

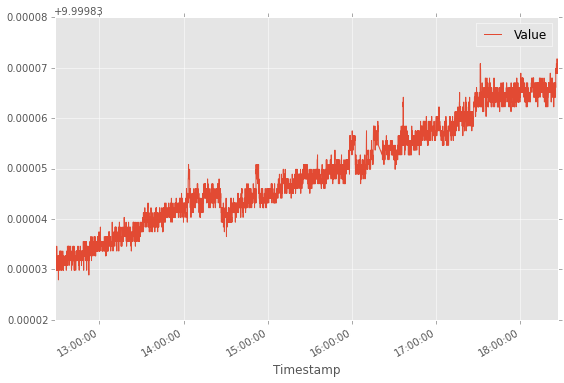
After the initial warm-up, the voltage continued rising for another 5 hours, before leveling out at about 9.99989v.

From2hr

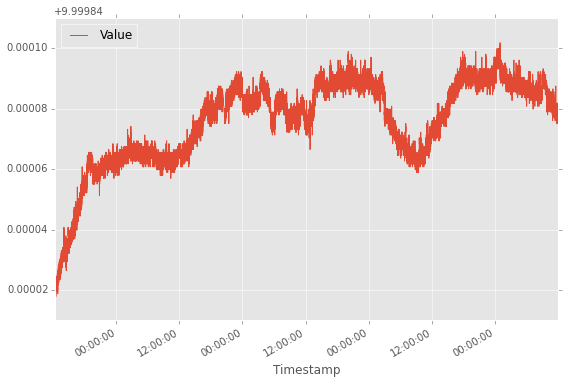
The graph above shows the voltage over ~4 days following the two hour warm-up period. If we look at the stability once the voltage first leveled out ~7 hours after turn-on, we see that it lies between 9.99990v and 9.99994v, which works out to be about 4 parts per million (ppm), which is better than the specified 7.5ppm 8-hour stability and the 10ppm 24 hour stability for the source and ~14ppm 24-hour stability of the DMM.

I’d guess that some of the variation is due to temperature changes. The EDC 521 specifies a temperature coefficient of +- 5ppm/C°, and the DMM has a temperature coefficient of about 2ppm. Unfortunately, I didn’t start collecting temperature readings until yesterday afternoon. Once have accumulated a few days worth of readings, I’ll look at the relationship between temperature than the voltage reading.

last3hr-bounds

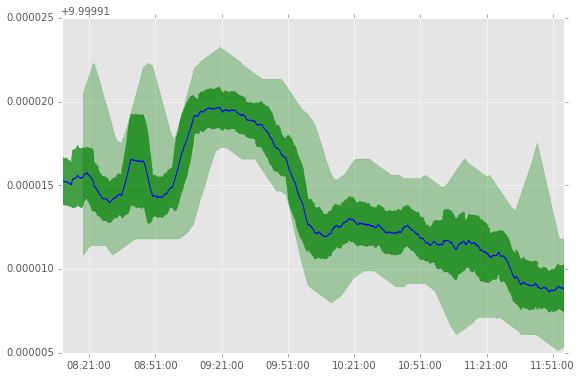
The last thing I did was look at short term variation in readings. The graph above looks at a 4 hour period earlier today. The blue line is a moving average of 10 minutes of readings (~120 readings), the dark green shows the standard deviation in readings over the same window, and the light green bounds the average of the minimum and maximum readings over the same period.

It shows that the difference between minimum and maximum readings are ~6uV, which is  less than 1ppm. The DMM is only a 6.5 digit DMM, which means that the smallest reading on the 10v range is 10uV. When readings are taken using the GPIB or RS-232 interfaces, it does report an extra digit, which is useful for statistical purposes. In this case, I think its safe to say that the short term variation in readings is probably mostly down to the DMMs noise floor.

After looking over this data, my conclusion is that I got what I was hoping to get, a stable and accurate precision voltage source. Next step is to test the GPIB interface and use it to collect data across every available setting and range to check for linearity/accuracy and decide whether any adjustments are needed.

New to Me: EDC 521 DC Voltage/Current Source

Last week I came across a miscategorized eBay listing for an Electronic Development Corp (EDC, now owned by Krohn-Hite) 521 DC Voltage/Current Source. It was listed in the network equipment section, with “Juniper” as the manufacturer.

The EDC 521 is a precision DC reference source with high accuracy, precision and stability, for the calibration of meters and sensors. It can output voltage in three ranges, (0-100mv, 0-10v, and 0-100v), and constant current in two ranges, 10mA and 100mA (with compliance voltages up to 100V). In each range, the precision/resolution of adjustment is 1ppm. Overall stability in Voltage mode, within the devices operating temperature range is 7.5ppm over 8 hours, 10ppm over 24 hours, 15ppm over 90 days, and 20ppm over a year. The temperature coefficient (which is included in the above estimates). It is microprocessor controlled and has a GPIB interface to allow remote control.

To achieve its basic stability, it uses an aged and selected 1N829 temperature compensated Zener diode as its primary voltage reference. This diode is driven by a stable precision current source at a current chosen to provide the best combination of temperature stability, long-term drift and low-noise for the individual diode used in each unit. Adjustments are made using a custom, precision 24-bit digital to analog converter.

Voltage divider resistors and 1N829a temperature compensated zener voltage reference.

The DAC works by feeding the reference voltage across a resistor divider to obtain 10 output voltages, tapped at 500mV intervals. If I understand correctly, these voltages are switched to provide analog voltages for each decade, these voltages are buffered, then then weighted and summed using some precision resistors before being fed to the output amplifier.

When the package arrived yesterday, I saw why the listing had been miscategorized — it was packed in a box for a Juniper Networks switch. That, and the sticker noting a failed calibration attempt in 2009 makes me doubt the seller’s assertion that it was “pulled from a working environment.” Not that I expected a pristine, calibrated instrument for $150.

IMG_8649

Inside the box, I found things in a bit worse physical shape than I expected. What I thought was shadow/glare in the photo from the ebay listing, was actually a torn red filter over the LED display. And the underside of the case, which wasn’t pictured in the listing, had a huge dent.

IMG_8625IMG_8643

On closer inspection, the dent didn’t reach the PCB inside, and I was able to remove the panel and hammer it out. Once inside, I found that everything had a fine coating of persistent dust. Hitting it with canned air shook some of it loose, but most of it remained.

So, I got to work rinsing it with a lot of isopropyl alcohol which I then chased off the edge of the board with canned air. After a few repetitions, the top and bottom side of the board were pretty clean. I then looked over both sides of the board closely, looking for damaged components, and cleaning out little pockets of residue.

I didn’t see any damaged components, but along the way noticed signs that the board had received some major revisions. There was an obvious bodge wire on the bottom of the PCB, but it was also clear that new holes had been drilled to receive additional components. On the top side, I found a cut trace, along with a couple of added resistors and a couple of capacitors. I haven’t traced everything out, but its obvious that the bodge wire connects to one end of the internal reference divider, and the rest of it is on the opposite end, so it would seem likely that its helping isolate the reference divider, and the voltages it produces, from noise sources.

It also appears that a number of power transistors have been replaced. Unfortunately, none of the components in question have obvious date codes, so its hard to guess when the modifications were done, and whether the transistors and the filters were added at the same time. Perhaps one of you knows how to decode the markings?  First line is a Motorola logo followed by “616,” the next line is “JE350,” which is the model/part number. The datecodes on other components pretty much all date to late 1996, and the MPU board has a label with the firmware revision and is dated January 1997.

Before closing it up, I took care of the loose plastic supports for the back-edge of the PCB, which holds heavy electrolytic filter caps for the power supply. I cleaned the old, crusty, failed double-sided foam tape off and replaced it with new tape so I could stick the supports to the back of the chassis again.

I powered it up, and gave it a quick check on all the voltage and current ranges. It seems pretty close to its 1 year tolerances. I was surprised by the amount of time it took to warm up and stabilize, but when I checked the manual, I saw that the warm up time is speced at 2 hours.

IMG_8648 IMG_8647

I powered it down over night. This morning I set up my computer to voltage readings ever few seconds and then powered it back up. I’ll post a graph once I have a days worth of data. After that, I’m going to write a script to run through all the possible settings and log the measurements. So, more to come!