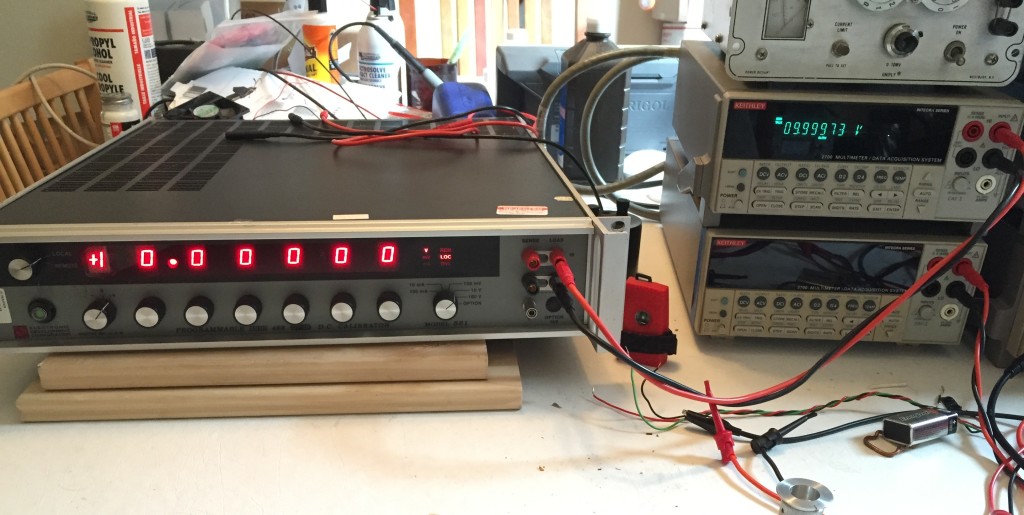
Last week, I cleaned up the used EDC 521 DC Voltage & Current Source I bought on eBay and ran it through some quick tests. The next day, I connected it up to one of my Keithley 2700 6.5 digit multimeters, started logging readings, and powered it up. Since then, I’ve been collecting voltage readings every 5 seconds so I could get a better sense of the device’s stability and accuracy.
The EDC 521 was set to 10.00000v and powered on.
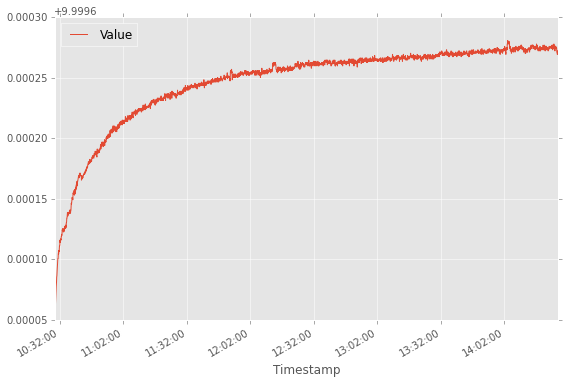
Once the self-tests ran the output turned on. The initial voltage was only 9.99954v, but climbed quickly. After 15 minutes, it was up to 9.99981v and still rising gradually. At the end of the specified two hour warm-up period, it was 9.99986v, well within the specified tolerance of 0.000258v (0.002% of setting + 0.0005% of range + 3uV), as well as the DMMs uncertainty of 0.000350v 30ppm of reading + 5ppm of range.
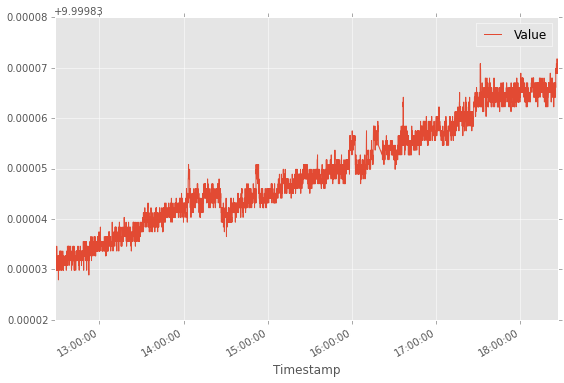
After the initial warm-up, the voltage continued rising for another 5 hours, before leveling out at about 9.99989v.
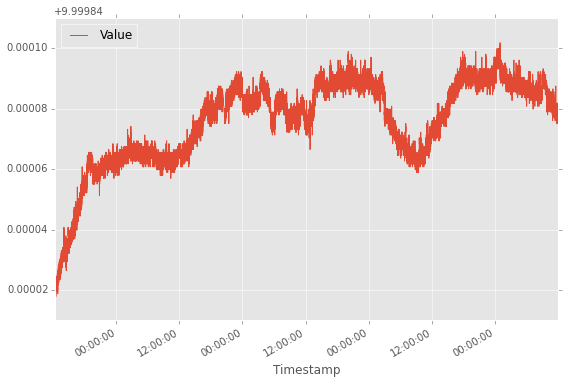
The graph above shows the voltage over ~4 days following the two hour warm-up period. If we look at the stability once the voltage first leveled out ~7 hours after turn-on, we see that it lies between 9.99990v and 9.99994v, which works out to be about 4 parts per million (ppm), which is better than the specified 7.5ppm 8-hour stability and the 10ppm 24 hour stability for the source and ~14ppm 24-hour stability of the DMM.
I’d guess that some of the variation is due to temperature changes. The EDC 521 specifies a temperature coefficient of +- 5ppm/C°, and the DMM has a temperature coefficient of about 2ppm. Unfortunately, I didn’t start collecting temperature readings until yesterday afternoon. Once have accumulated a few days worth of readings, I’ll look at the relationship between temperature than the voltage reading.
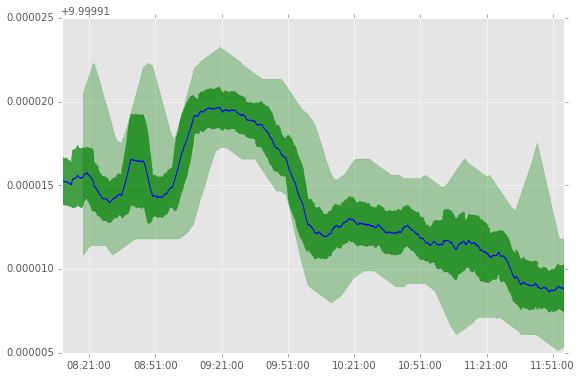
The last thing I did was look at short term variation in readings. The graph above looks at a 4 hour period earlier today. The blue line is a moving average of 10 minutes of readings (~120 readings), the dark green shows the standard deviation in readings over the same window, and the light green bounds the average of the minimum and maximum readings over the same period.
It shows that the difference between minimum and maximum readings are ~6uV, which is less than 1ppm. The DMM is only a 6.5 digit DMM, which means that the smallest reading on the 10v range is 10uV. When readings are taken using the GPIB or RS-232 interfaces, it does report an extra digit, which is useful for statistical purposes. In this case, I think its safe to say that the short term variation in readings is probably mostly down to the DMMs noise floor.
After looking over this data, my conclusion is that I got what I was hoping to get, a stable and accurate precision voltage source. Next step is to test the GPIB interface and use it to collect data across every available setting and range to check for linearity/accuracy and decide whether any adjustments are needed.
