I’m building a few custom audio amplifiers for my personal use out of some inexpensive modules based on the Texas Instruments TPA3118 and TPA3116 Class D amplifier chips.
Class D amplifiers are basically variable switching regulated power supplies (SMPS), which makes them compact and power efficient when compared to traditional amplifiers, which are much more like linear regulated power supplies. The switching frequencies are designed to be well outside of the range of human hearing (and the circuits and transducers we use to reproduce sound) so that it can be filtered without interfering with the audio, and so any remaining signal at switching frequencies is inaudible. In the case of the modules I’m using, the switching frequency is ~400KHz.
The modules I am using have LC (inductor + capacitor) filters on their outputs in order to filter the switching frequency before sending it to the speakers, but I was concerned that the modules would also inject noise onto the power supply rails. TI has provisions for slaving multiple chips together so that they use the same switching clock and can avoid distortion due to interactions on the power supply bus, but the modules I’m using don’t expose the necessary pins, and the small component sizes and spacing between the PCB traces didn’t make me eager to hack them.
Some people have addressed the issue by dedicating a separate power supply to each module, but all things being equal, using a single supply should be cheaper and more compact. I asked for advice on the DIYAudio.com forum, and got some general suggestions, but nothing specific enough to be actionable. I was going to need to do more of the legwork myself.
So, first step, was to see if there were any existing solutions. I started reading datasheets and application notes, but I didn’t find what I thought I needed. I did learn though that, in addition to the switching frequency, Class D amps draw current at either 1x the audio input frequencies, when configured as a half-bridge, or 2x the audio input frequency, when configured as a full bridge.
Next step was to measure magnitude of these potential PSU noise sources in a naive implementation, with no added filtering beyond the PSU’s output filters and the modules PSU input filters.
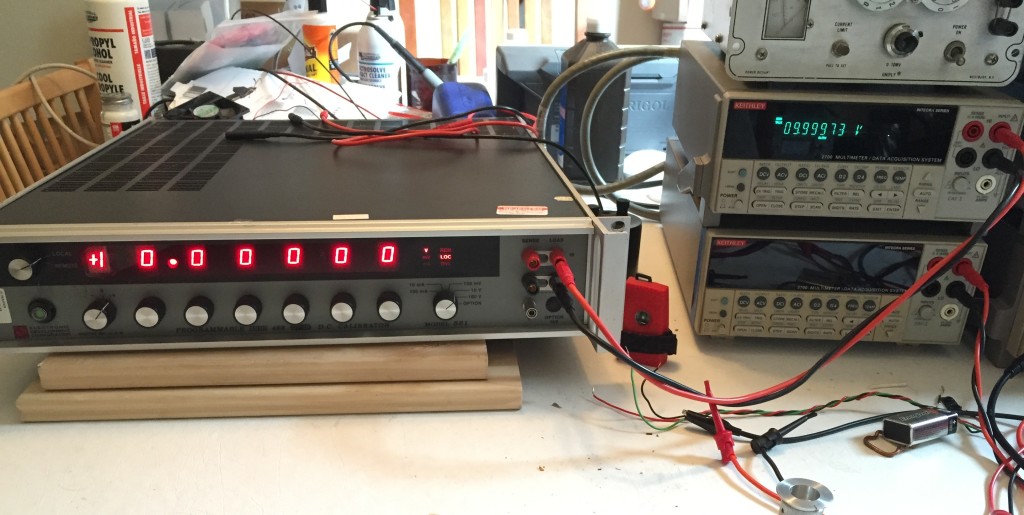
I used the 24v DC PSU I had handy, an ~10-12 year old 65W Apple 24V PSU intended for a Macintosh PowerBook. I haven’t seen a teardown of the PSU, but in general, Apple seems to put a lot of effort into making their PSUs electrically robust and low noise.
I paired this with a Sanwu “Blue” TPA3118 PBTL mono module. which has ~1320uF (2x 2x 330uF) of electrolytic decoupling caps on the power rails. I then hooked up my oscilloscope and an Analog Discovery to do the measurements.

With no signal input to the amp, this is what the power supply rail (yellow) and the amp output (blue) look like. You can see that there is a sinuous ~400KHz, 1.2v peak-to-peak signal on the output from idle switching of the output bridge. You can also see evidence of this switching on the power rail, at the same fundamental frequency, but with a lot of ringing. The 400KHz component is about 50mV peak-to-peak, while the higher-frequency ringing and transients are about 190mV p-p.
I also took measurements using my Analog Discovery as a spectrum analyzer.
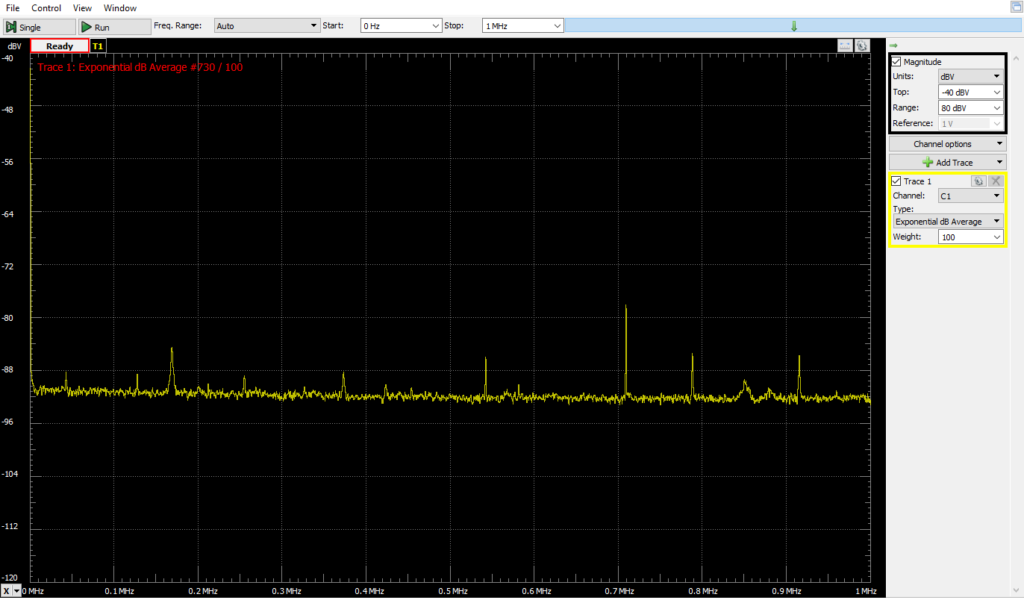
First with everything connected, but no AC power applied to the PSU.
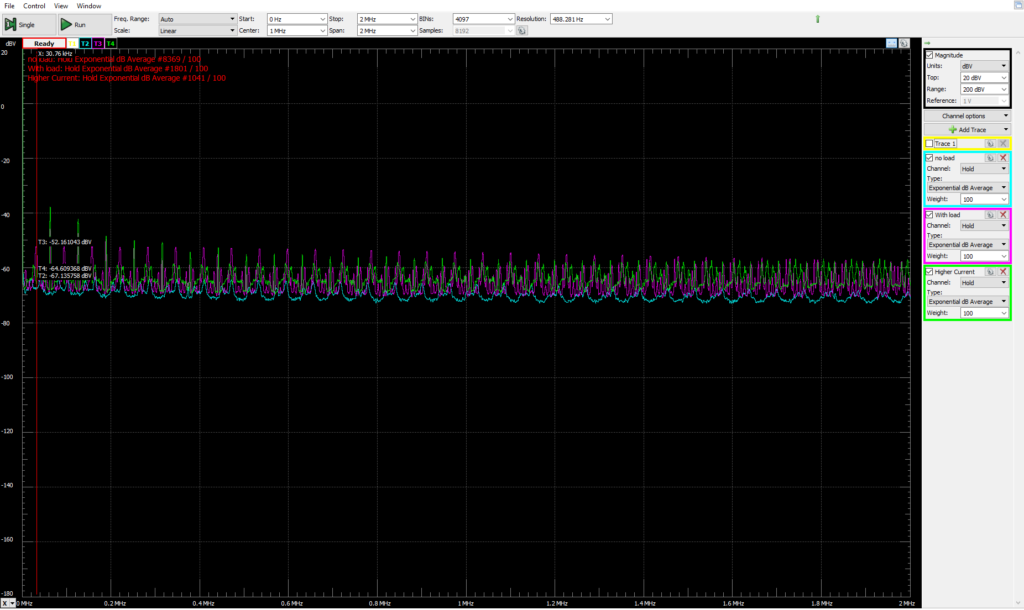
Next, with AC power, and various resistive loads. I was sloppy and didn’t record the exact condutions, but it gives some sense of what the PSU noise is and how it changes with load. Blue is with no load, magenta is with ~30 Ohms, Green is with ~15 Ohms. Also, note, this is a relatively wide spectrum range, from ~0 to 2MHz.
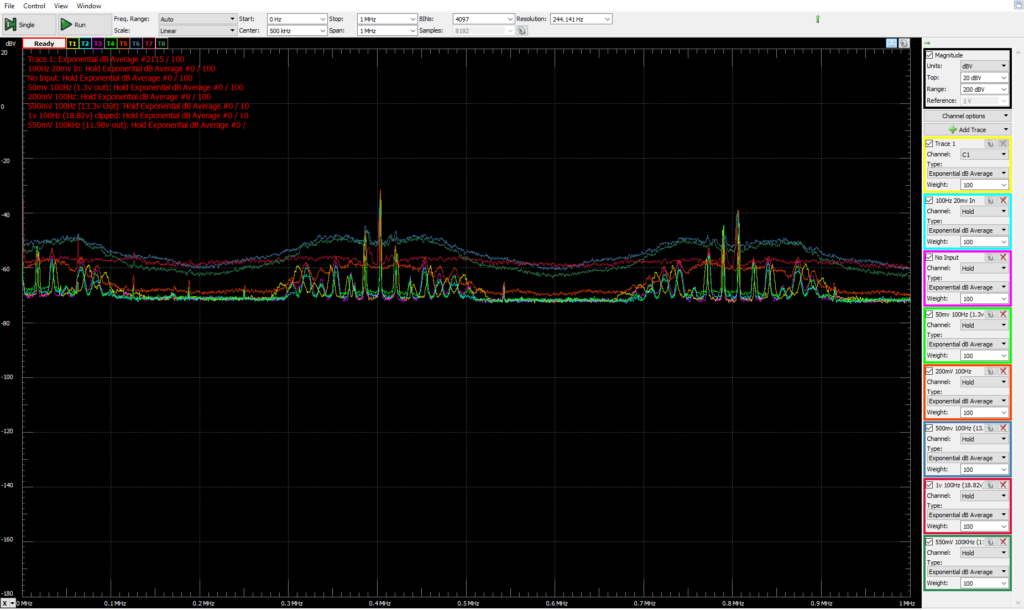
With the amp as a load (driving a 7.5Ohm power resistor). There is a 100Hz input to the amp. Each trace is a spectrum measurement of the PSU with a different input amplitude, from signal-off to 1v peak-to-peak. These readings were DC coupled, so the measurement reflects the DC voltage component. As a result, the average level for each trace is closer to the baseline as the DC voltage of the PSU rails sags at higher output powers.
There are peaks at the 400KHz switching frequency, and its harmonic at 800KHz. I’m not sure I understand all the little peaks that group around on each side of the switching frequency.

In the time domain, we can see the amplifier-induced PSU ripple & noise in the yellow trace, along with the amplifier output signal from a 500mv p-p, 100Hz input signal. There is a 200Hz ripple on the power supply rail as the amplifier bridge switches on 2x for each input cycle, once to drive the output high, and then again, in reverse polarity, to drive the output low. This ripple is ~500-600mV p-p and its phase is offset a bit from the output waveform. On top of that, you can see the switching noise in the high-frequency “fuzz” on the power supply rail. This “fuzz” is about 1.3v P2P. The two components together add up to ~1.96v of swing.

Pushing the input higher quickly runs into problems. With 1v input p-p, things look rather nasty as the peaks get brutally clipped off against the limits of the PSU voltage.
-
- 0-500mv 50Hz input signal
-
- 0-550mv 100Hz input signal
-
- 0-500mv 10KHz input signal
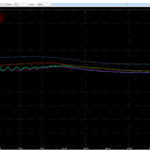
I also took PSU rail frequency measurements with input signals of 50Hz and 10KHz.
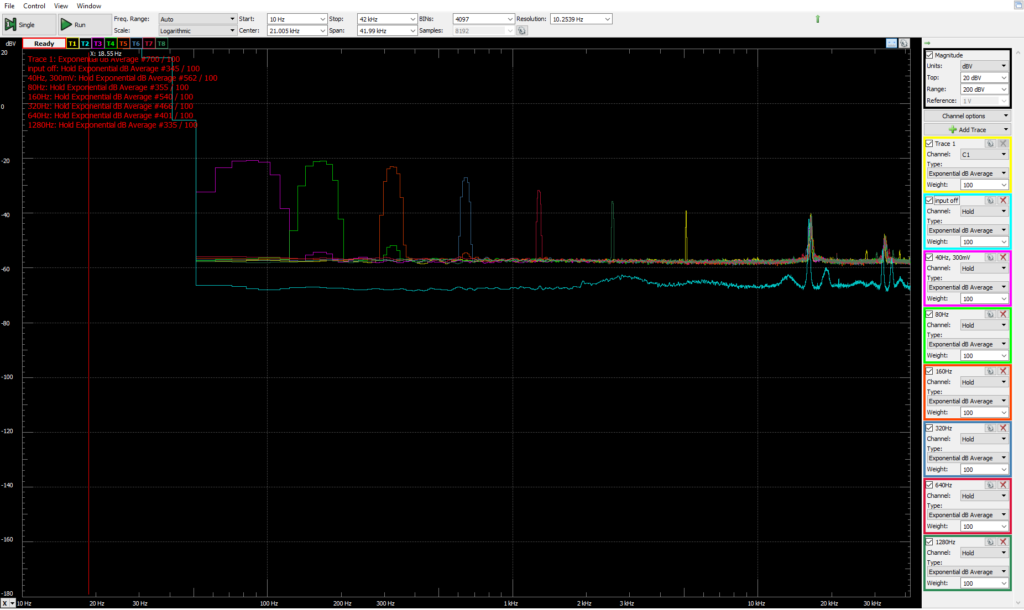
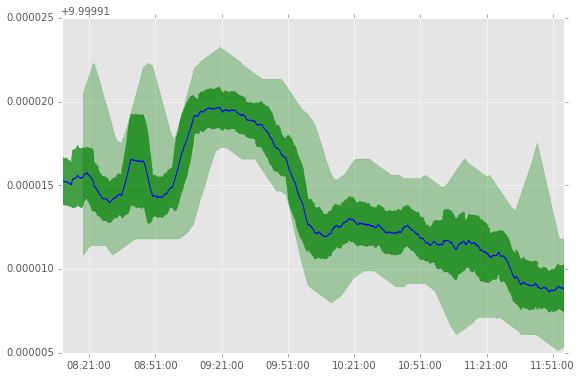
I decided to wrap things up by looking more closely at the impact on PSU voltage at different input audio frequencies. Since the human hearing falls off sharply above 20KHz, and the amp current draw varies at 2x the input frequency, I limited the top of the measurement range to 42KHz. The input signal was 300mv peak-to-peak, and the input frequency was stepped starting at 40Hz and ending at 1,280Hz.
I’m really not sure what the high-frequency peaks are starting at 18KHz or so. I probably should have looked into them more closely.
Now that I have the measurements, I have to make sure I actually understand them before I figure out what to do, and how to do it. I note that in PBTL mode, the chip has a power supply ripple rejection ratio of 75-80dB up to 1KHz, rising to ~55dB at 8KHz and continuing at that level for the rest of the audio range.